VisNetwork
Interactive network graphs with context menus and drag interactions.
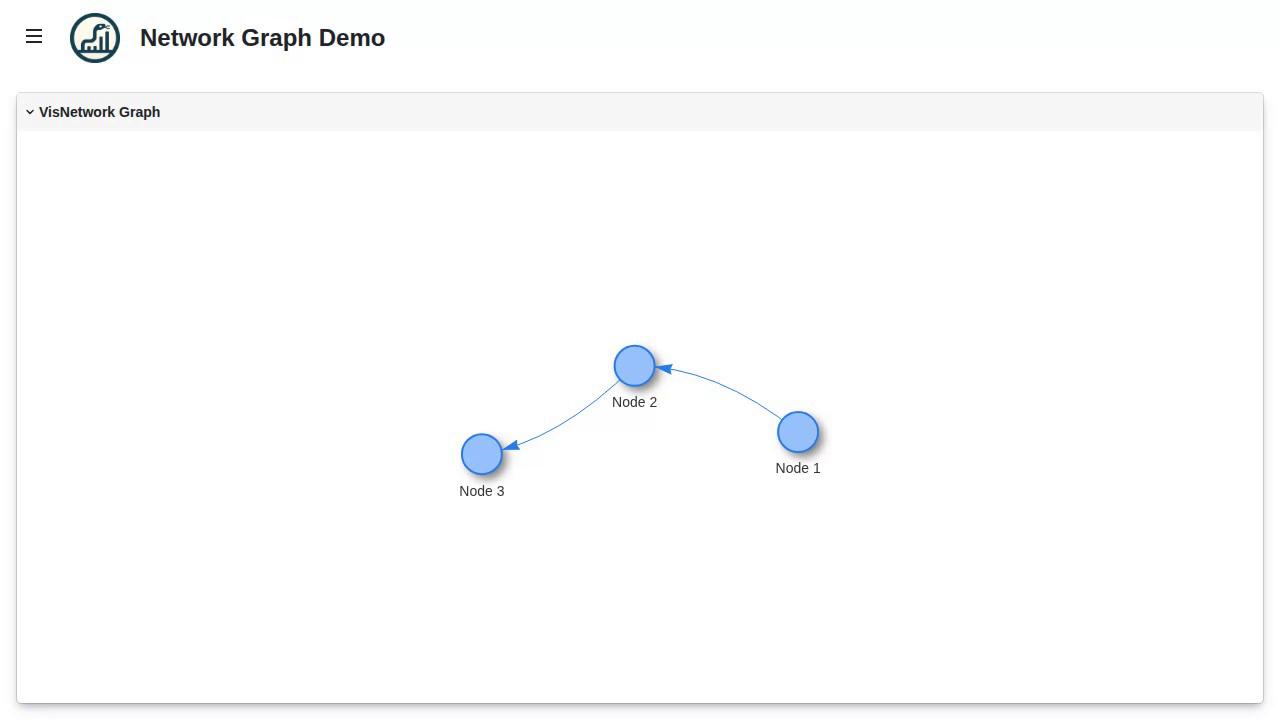
Interactive network graph with vis-network + Vue.

Right-click nodes and edges to run per-element actions from Python.

Hold Ctrl and drag to clone nodes, with a post-processing callback.
More examples
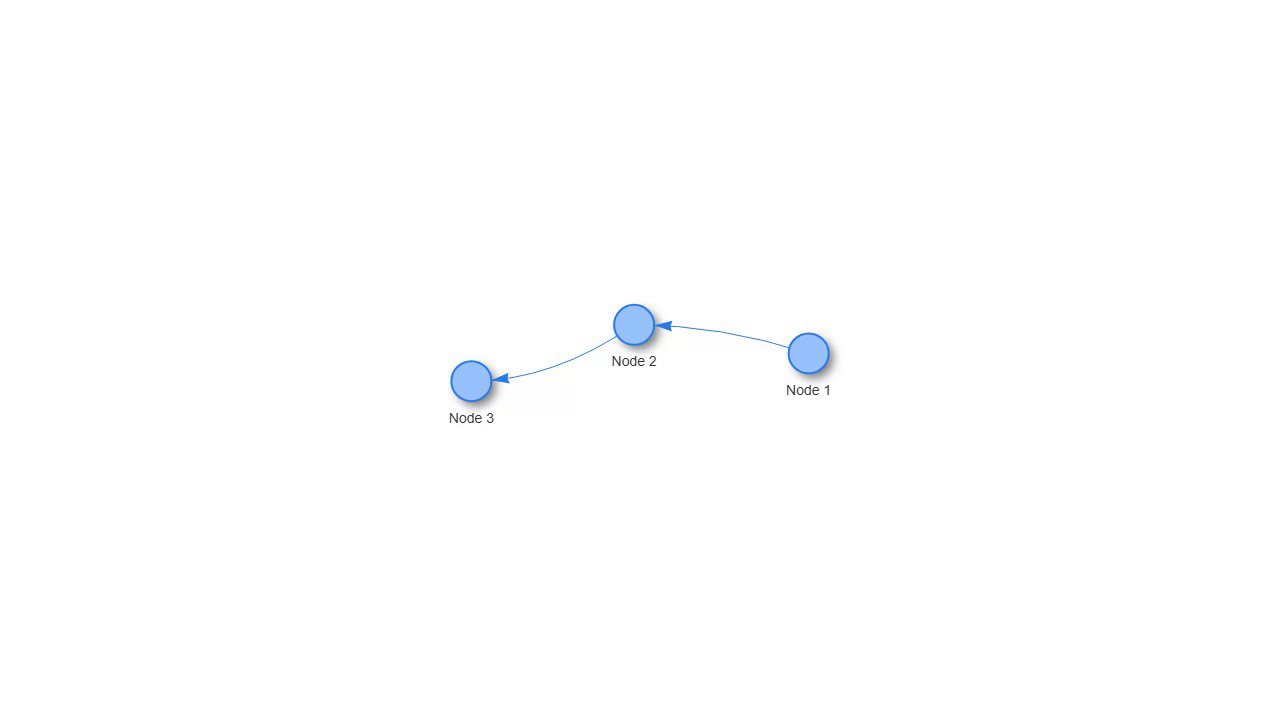
The same graph without the Panelini shell.

Attach json_data to a node and show it as a YAML tooltip on hover.
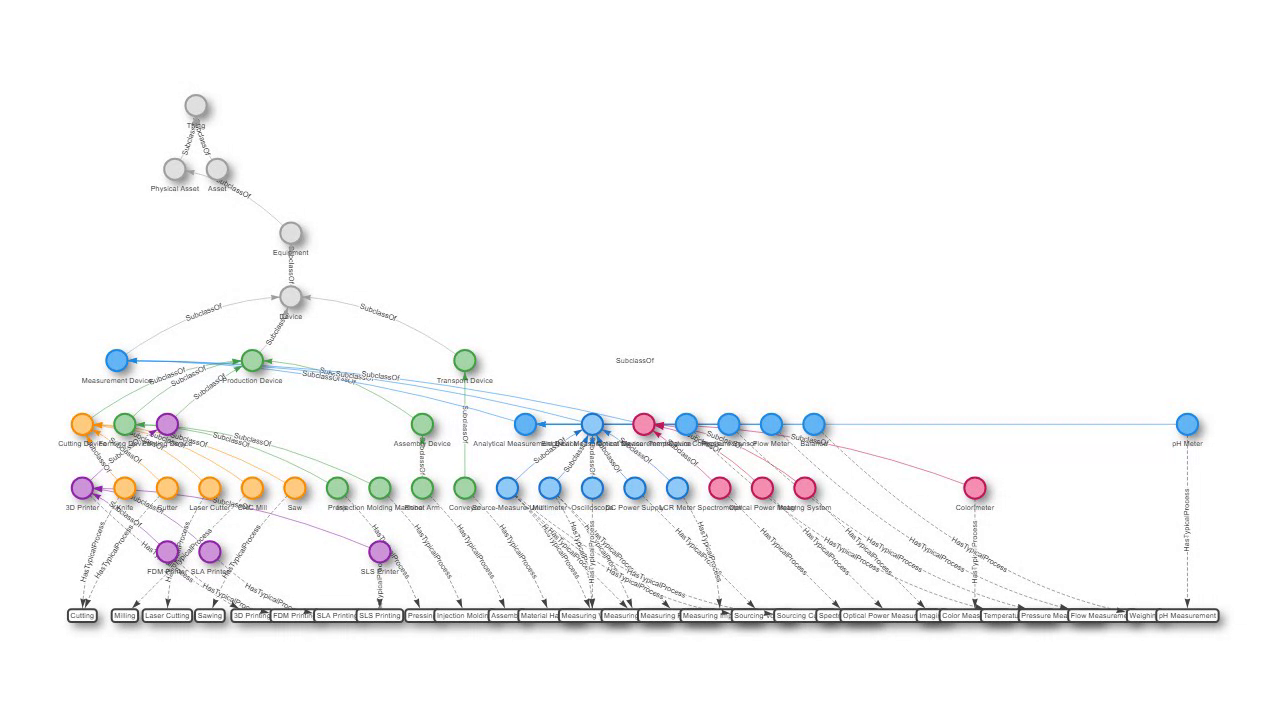
A device ontology in a top-down hierarchical layout with typed edges.
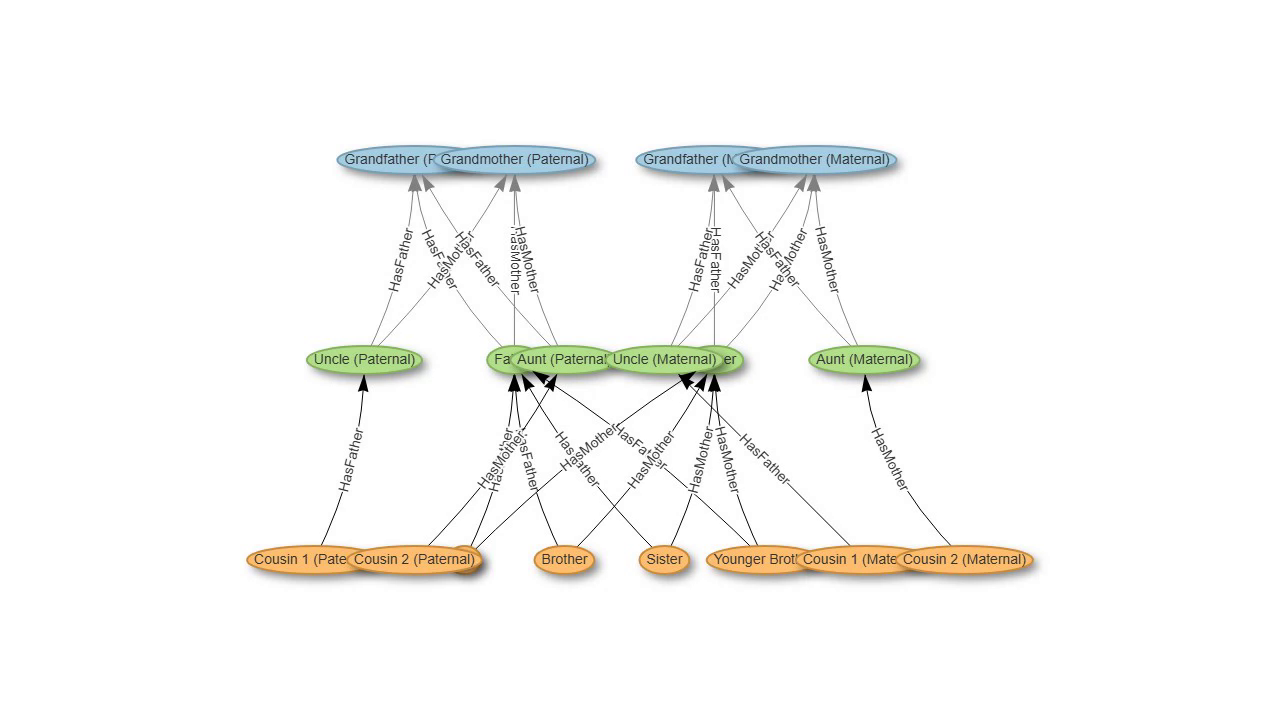
A family tree with fixed node positions and labeled relations.
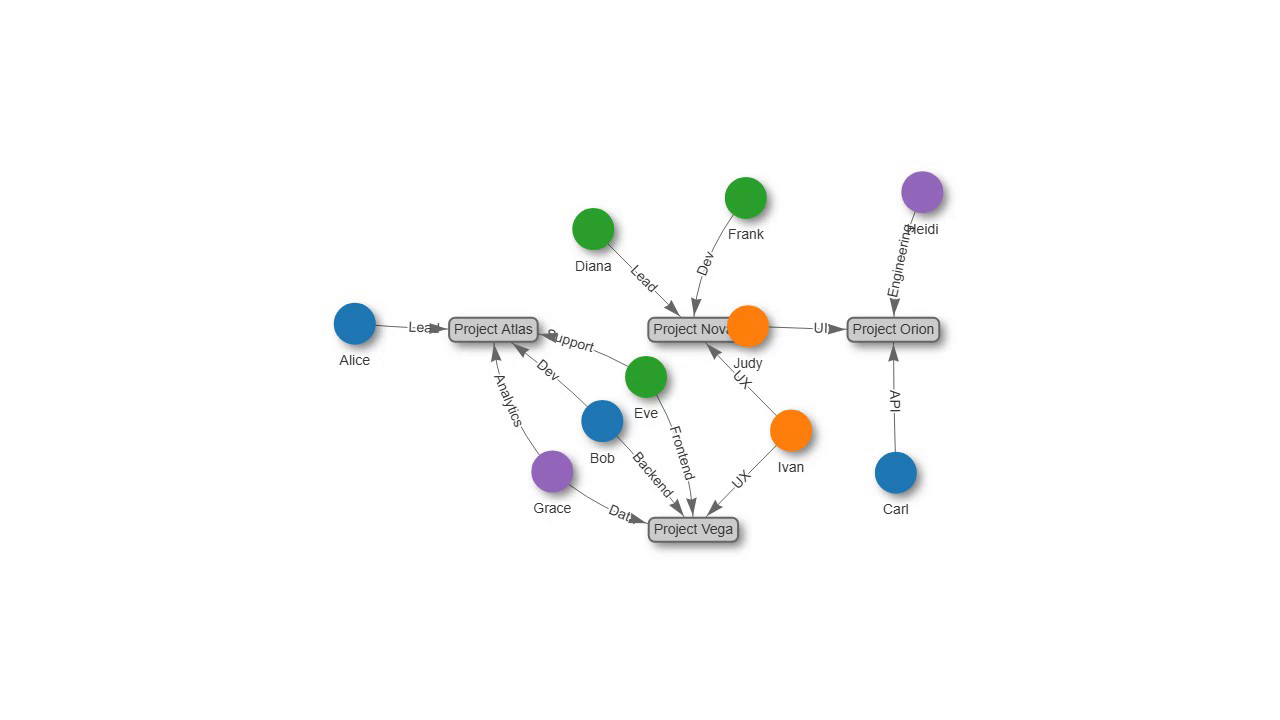
People and projects colored by team group with a physics layout.
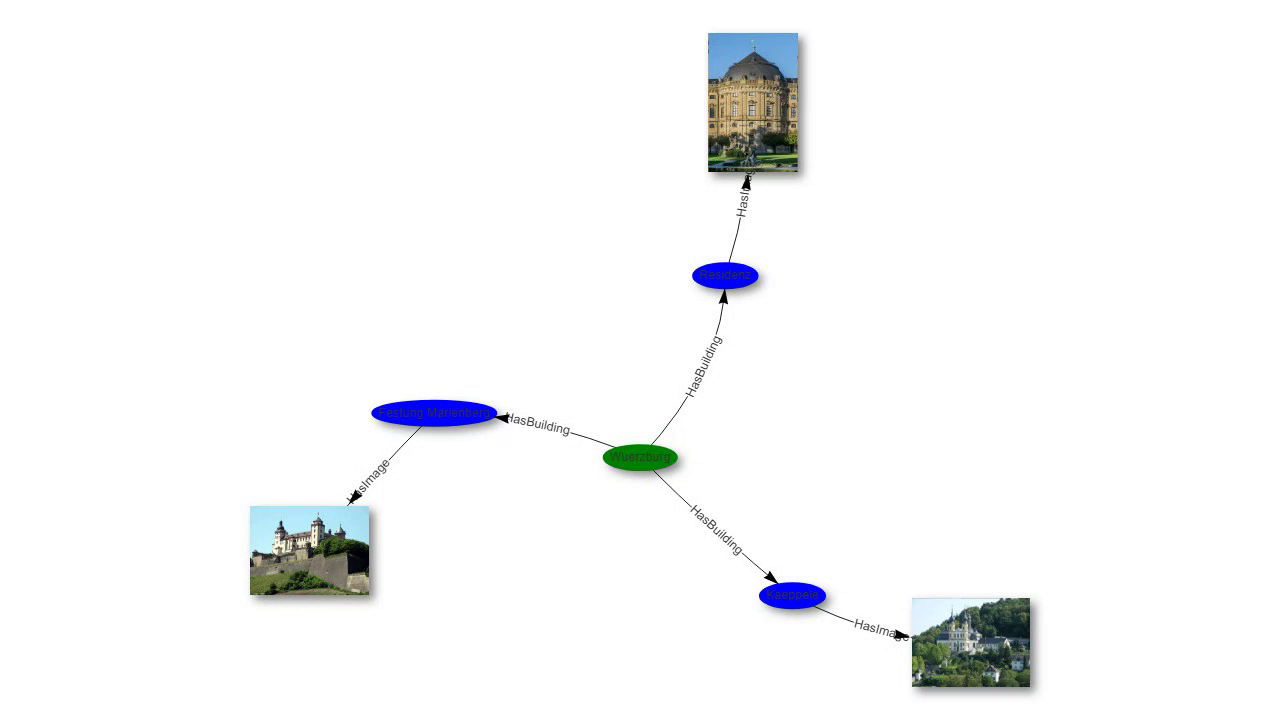
Render nodes as remote images.
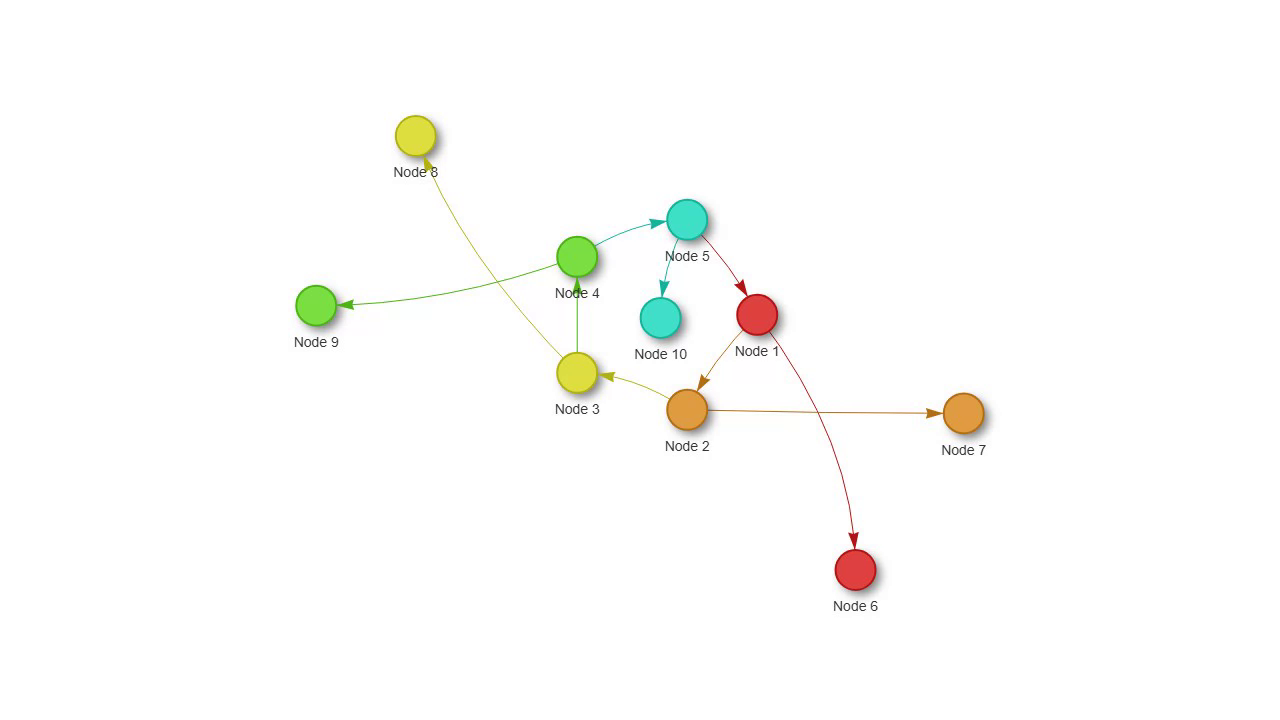
A ring of fixed nodes plus free nodes (the rotation runs when you run it locally).

Drop image or CSV files onto the canvas to spawn nodes.
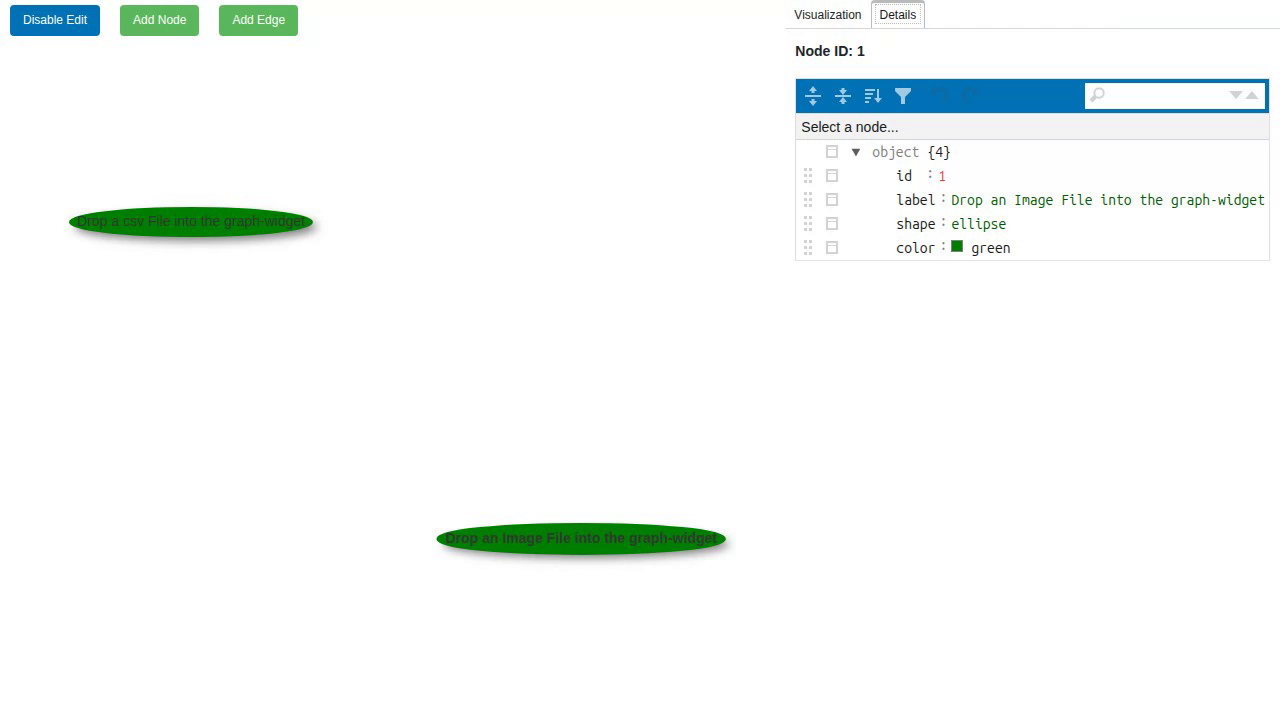
The GraphDetailTool workspace seeded with file-drop nodes.
Build a knowledge graph step by step with an action playbook.