VisNetwork graph inside panelini
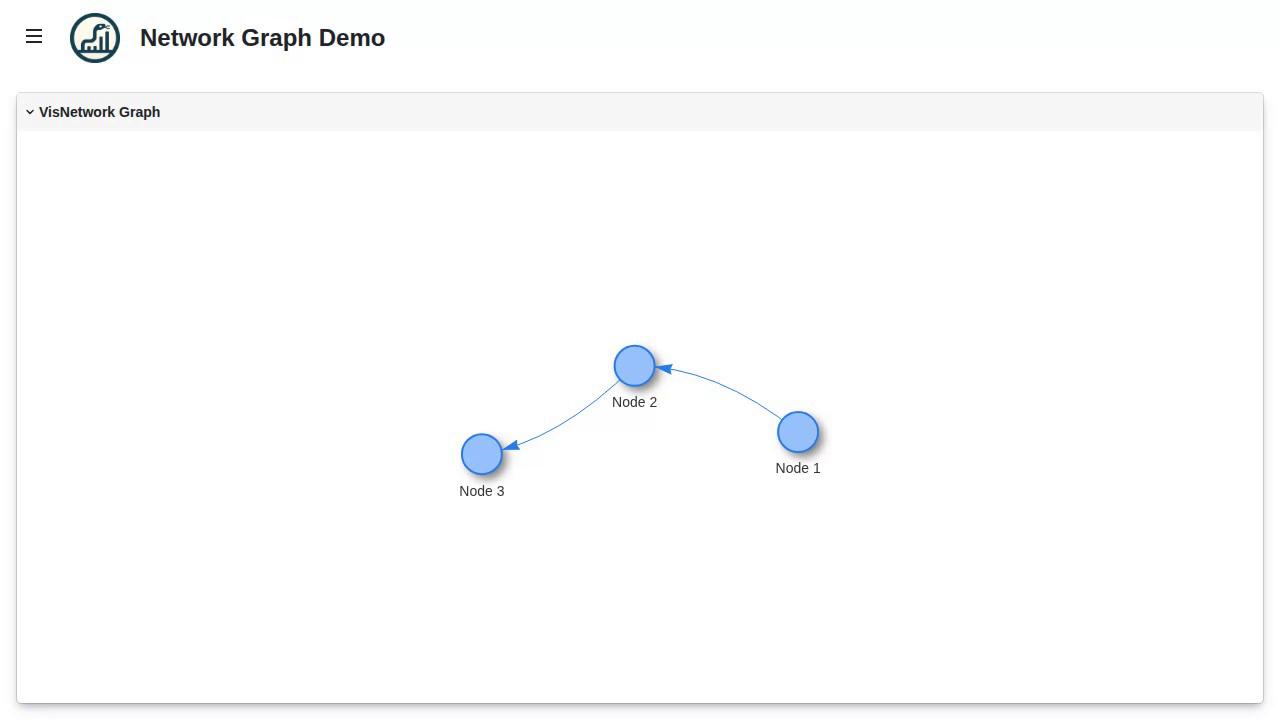
Source: examples/panels/visnetwork/visnetwork_panelini_min.py
Test: tests/panels/visnetwork/examples/test_visnetwork_panelini_min.py
Three nodes, two edges, one responsive panelini shell.
The code
import panel as pn

from panelini import Panelini
from panelini.panels.visnetwork import VisNetwork

nodes = [
    {"id": 1, "label": "Node 1"},
    {"id": 2, "label": "Node 2"},
    {"id": 3, "label": "Node 3"},
]
edges = [
    {"from": 1, "to": 2},
    {"from": 2, "to": 3},
]

visnetwork_panel = VisNetwork(nodes=nodes, edges=edges)

app = Panelini(title="Network Graph Demo", sidebar_visible=False)
app.main_set(objects=[
    pn.Card(
        title="VisNetwork Graph",
        objects=[visnetwork_panel],
        max_height=800,
    ),
])
app.servable()
That’s it - VisNetwork is a standalone panel wrapping vis-network. It renders immediately, animates physics-driven layout, and accepts drag interactions out of the box.
What’s under the hood
        graph LR
    py[Python props<br/>nodes, edges, options] <--> bridge[AnyWidget bridge]
    bridge <--> vue[Vue wrapper]
    vue --> visjs[vis-network JS]
    visjs --> canvas[HTML canvas]
    canvas -- events --> vue
Python-side
nodes,edges, andoptionsareparamproperties - update them and the frontend re-renders.User interactions (clicks, drags, file drops) flow back via the
_event_dataparam; Python callbacks run reactively.Bundled JS + CSS mean there’s no extra install step - vis-network ships with panelini.
Going further
The example above is the smallest possible usage. Everything else - event callbacks, edit modes, file drops, batch updates - is documented with runnable snippets in VisNetwork.
For a richer demo, try:
examples/panels/visnetwork/graph_detail_tool.py- fullGraphDetailToolworkspace with node detail pane, multi-select, and drag position trackingexamples/panels/visnetwork/drop_file.py- drop images/CSVs onto the canvas to spawn nodesexamples/panels/visnetwork/device_hierarchy.py- hierarchical layout with collapsible groups
Run it live
This example runs entirely in your browser via Pyodide. The first load downloads packages, so give it a few seconds.
See also
VisNetwork - full
VisNetworkguideGraphDetailTool - composed graph editing UI